Sales Scenario Analysis
Start with a sales table and a durable worksheet discount assumption, then use pandas to compare baseline and discounted revenue. This is deliberately the introductory/product-walkthrough template: the arithmetic is simple enough to understand immediately while the same worksheet-to-Python pattern scales to richer scenarios.
Result preview
With the supplied 10% discount, baseline revenue is $10,890, scenario revenue is $9,801, and the modeled change is -$1,089 while unit demand is held constant.
What this template does
- Reads Month, Units, and Price from Excel.
- Reads the scenario discount from a blue worksheet input used by the workbook and live demo.
- Validates numeric inputs instead of silently converting bad data to zero.
- Calculates baseline and discounted revenue by row and in total.
- Adds a notebook chart and optionally publishes the compact summary back to Excel.
Why Python
A normal Excel formula is sufficient for this exact calculation. Python is useful here as an intentionally small example of the integration pattern: worksheet inputs become a pandas DataFrame, analysis produces reusable outputs, and richer visualization can live beside the grid. Use the other templates when you need Python for algorithms that are materially harder to maintain with formulas alone.
Try it live
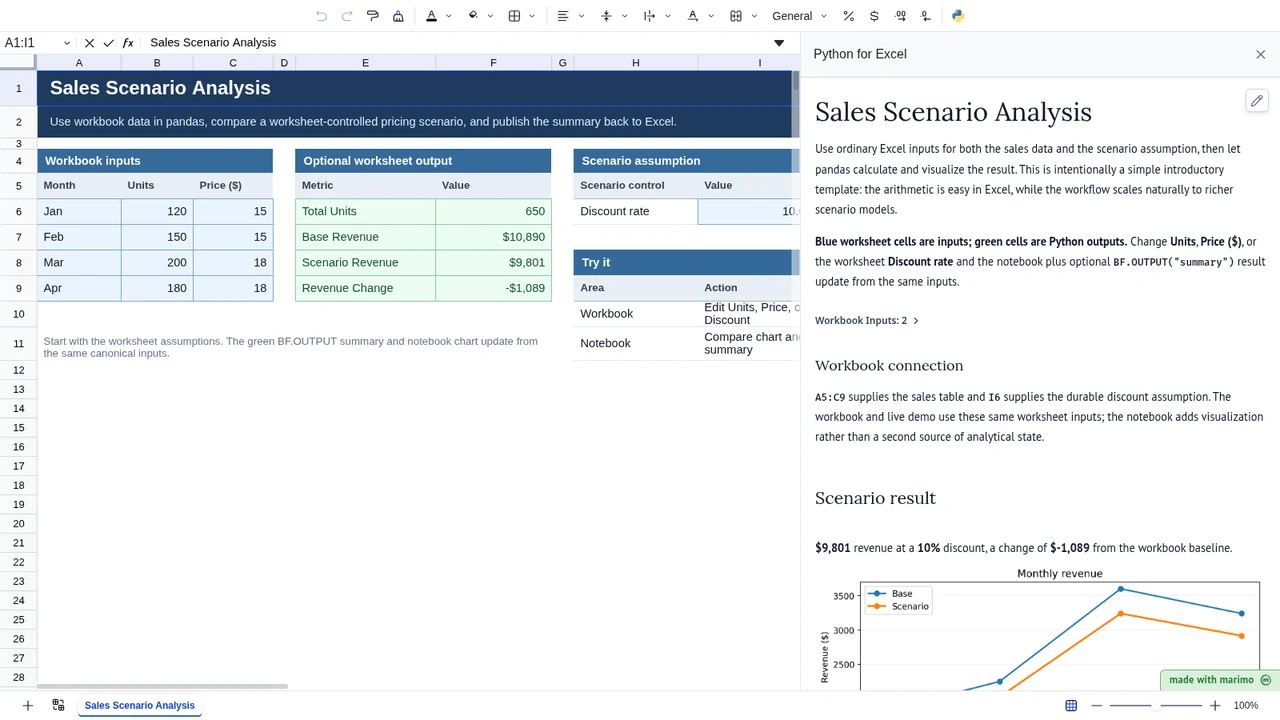
Edit Units, Price, or the worksheet Discount rate. The notebook chart and green summary use the same durable inputs.
Operating workflow
Author: an analyst maintains the worksheet binding, validation, scenario calculation, and published summary.
Workbook user: a sales or finance user updates units, prices, or the discount assumption and reviews the resulting scenario without needing to maintain the notebook code.
This introductory template can also be saved to open in App mode to practice the author-to-user handoff. App mode is a presentation preference rather than a security or permissions boundary.
Download the Excel template
Inputs and assumptions
| Input | Location | Default |
|---|---|---|
| Sales table | A5:C9 |
Four monthly rows |
| Discount rate | I6 |
10% |
The scenario applies one discount rate to every row and holds demand constant. It does not estimate price elasticity, margin, tax, or product-mix effects.
Notebook implementation
The Python for Excel notebook binds the same sales range and discount cell. Its added value is a reactive chart and optional worksheet publication, not a separate scenario assumption.
inputs = bf.inputs(
    sales=bf.ref("A5:C9", headers=True),
    discount="I6",
)
analysis = inputs["sales"].copy()
discount_rate = float(inputs["discount"])
bf.publish(outputs={"summary": summary})
How the calculation/model works
Sales scenario analysis compares a defined baseline with one or more alternatives. For each row, baseline revenue is Units × Price. Scenario revenue multiplies that amount by 1 - discount rate. The model then sums the rows and reports the difference. Negative or non-numeric Units/Price values and invalid discount rates raise explicit errors.
Validation / expected results
| Check | Expected value |
|---|---|
| Total units | 650 |
| Baseline revenue | $10,890 |
| Scenario revenue | $9,801 |
| Revenue change | -$1,089 |
The offline pytest/Univer gate executes the canonical notebook.py and verifies these baseline cells in the real Boardflare browser runtime. It then changes the worksheet discount to 20% and checks scenario revenue $8,712 and revenue change -$2,178.
Limitations
This is a scenario comparison rather than a demand model. A discount may change unit volume, contribution margin, channel mix, or other business variables that are intentionally held constant here. The template should therefore not be used as a pricing forecast without extending those assumptions.
When to use this approach
Use it to learn the Python-in-Excel workflow or to build a transparent first-pass scenario from tabular business data. For pricing decisions where demand responds to price, extend the model with elasticity or a sensitivity matrix rather than treating this result as a forecast.