Free
Capital Investment & DCF Risk Simulator
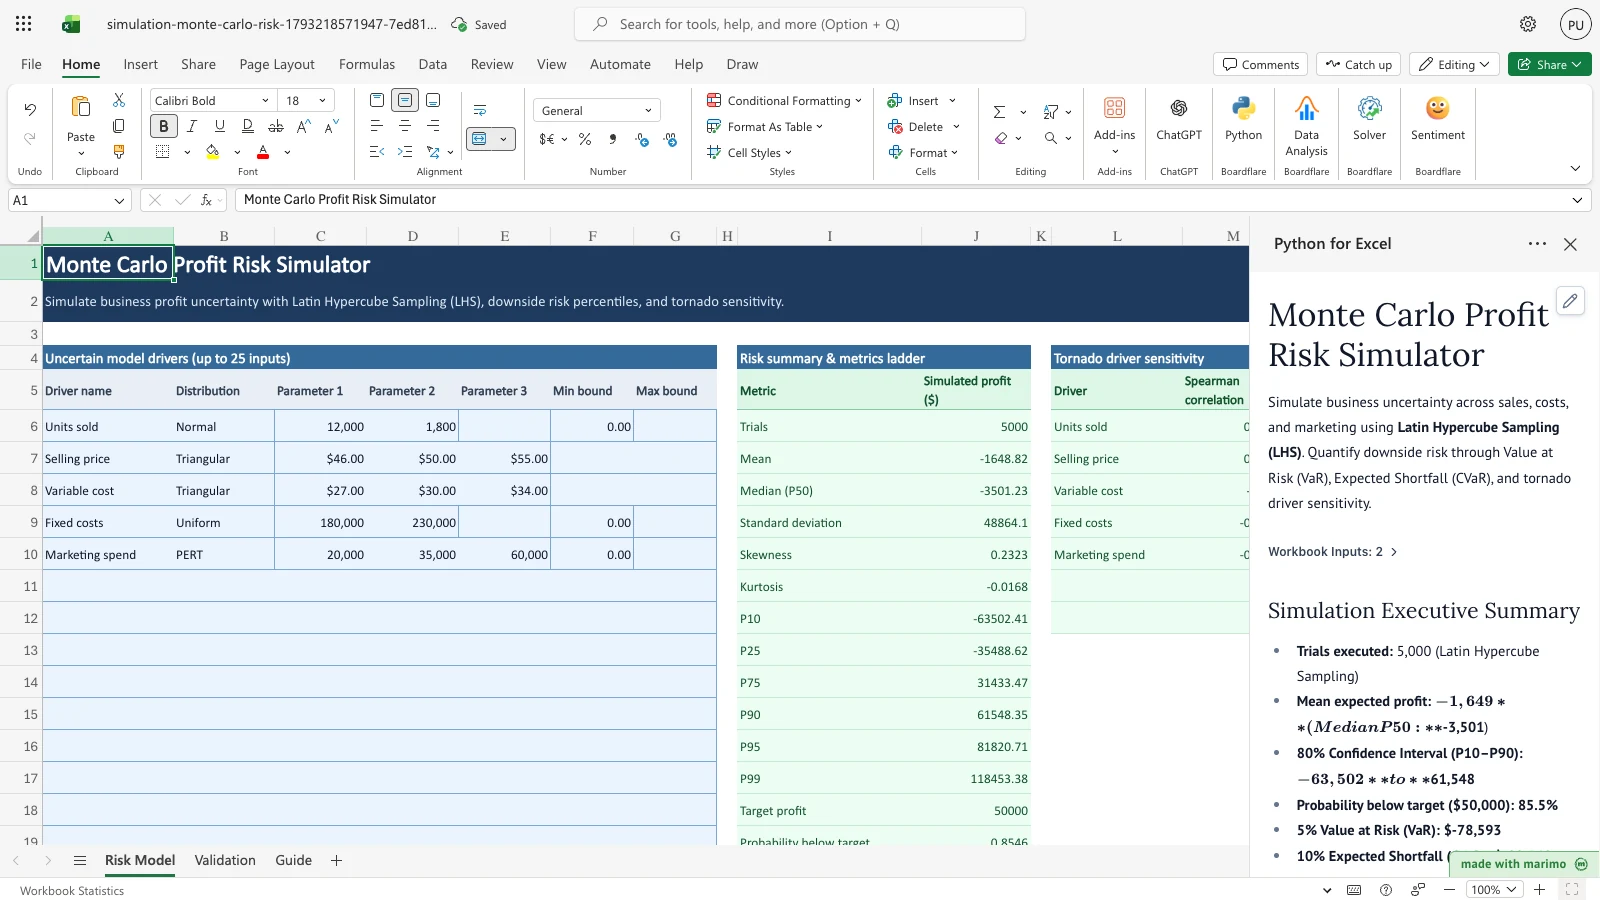
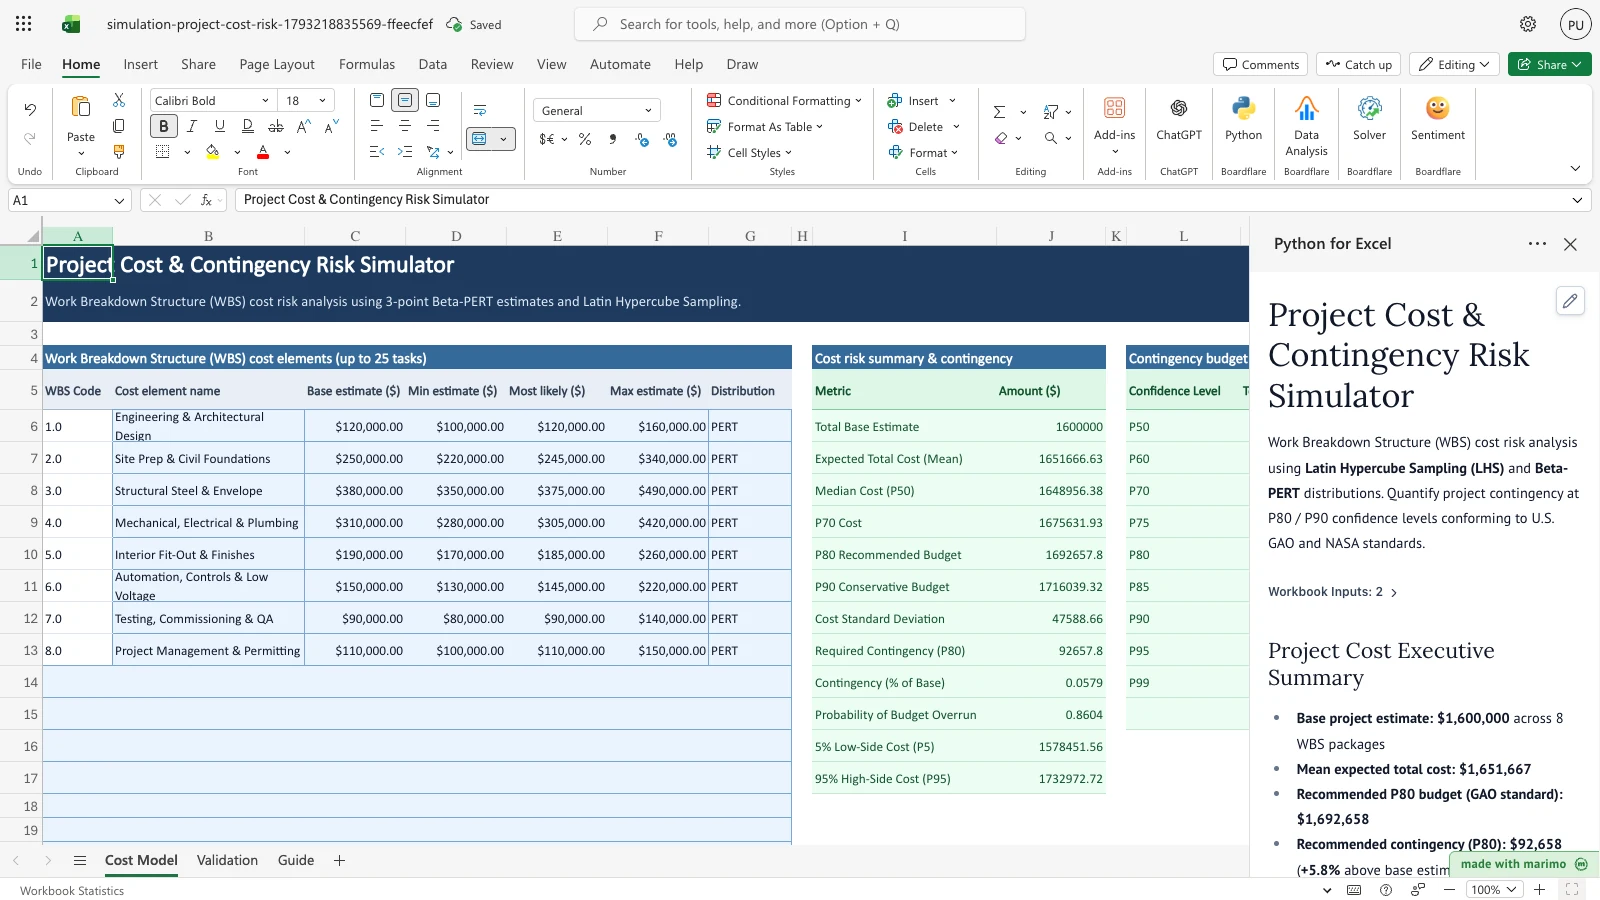
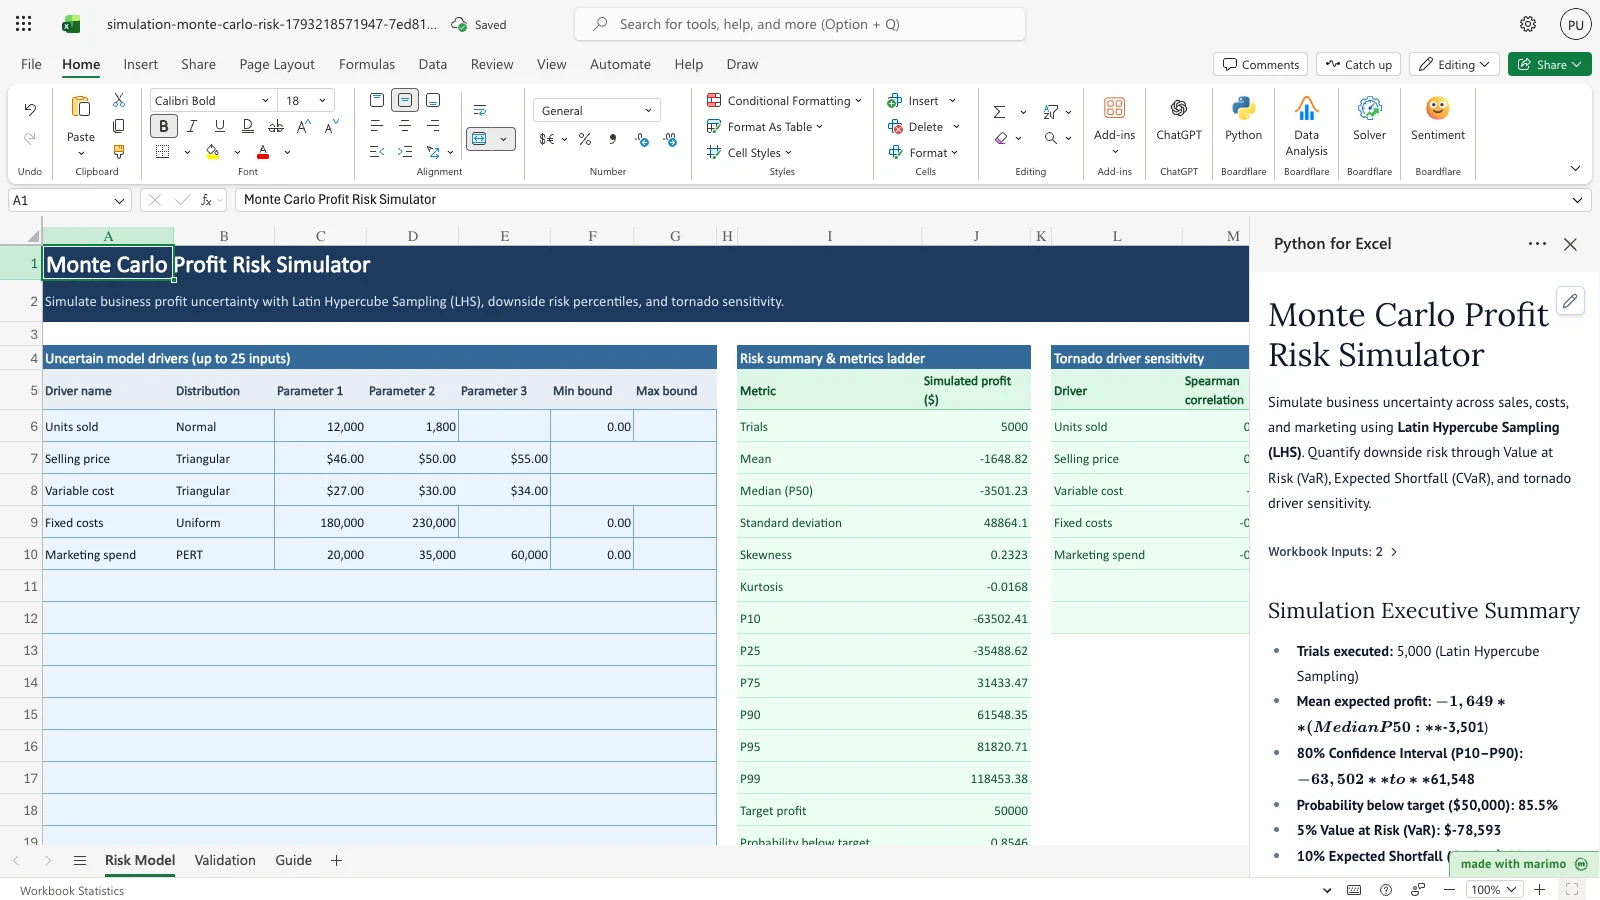
Multi-year capital expenditure and DCF risk analysis using Latin Hypercube Sampling, simulated NPV/IRR, downside tail risk, and tornado sensitivity.
Single-point spreadsheet forecasts hide the probability and severity of adverse outcomes. Whether forecasting new product profitability, capital expenditure budgets, or supply chain lead times, business assumptions are uncertain.
Boardflare embeds scientific Python (numpy, scipy.stats, scipy.stats.qmc) directly within Excel to run full Monte Carlo risk simulations on the client side. Interactive models execute 5,000 to 20,000 trials in under two seconds across Windows, Mac, and Excel Online with no cloud data transmission.
Simulation templates replace static cell values with probability distributions, propagate uncertainty across complex business relationships, and quantify downside risk:
| Feature | Excel Formulas (RAND(), Data Tables) |
Boardflare Simulation Templates |
|---|---|---|
| Recalculation behavior | Volatile; spins on every keystroke | Deterministic; recalculates only when inputs change |
| Sampling efficiency | Pseudo-random; requires >20,000 trials | Latin Hypercube Sampling (LHS); stable at 5,000 trials |
| Input correlation | None without custom complex copula math | Built-in Iman-Conover rank correlation induction |
| Distribution support | Limited native inverse functions | Normal, Lognormal, Uniform, Triangular, Beta-PERT, Discrete |
| Sensitivity analysis | Manual single-variable sensitivity tables | Automated Spearman correlation & variance-share tornado charts |
| Web compatibility | Data Tables freeze and fail in Excel Online | Universal client-side execution via WebAssembly/Pyodide |
| Analytical validation | None | Built-in closed-form benchmark validation sheet |