Forecast Accuracy & Bias Monitor
Evaluate forecasts only after matching each vintage and horizon to the correct realized target period. The workbook provides aligned forecast/actual rows and warning thresholds; Python for Excel calculates portfolio, horizon, series, and exception diagnostics.
Result preview
The supplied 96 aligned forecast rows produce 3.28% overall WAPE, 1.55% signed bias, and 0.785 MASE. Wholesale is the worst baseline series, while the three-step horizon has 4.98% WAPE.
What this template does
- Keeps forecast vintage, target period, horizon, forecast, and actual on each evaluation row.
- Calculates WAPE, signed bias, and MASE at portfolio, horizon, and series levels.
- Flags series that exceed worksheet WAPE or absolute-bias thresholds.
- Ranks worst series and largest row-level exceptions.
- Visualizes mean absolute percentage error as a series-by-horizon heatmap.
Why Python
Forecast monitoring requires grouping the same aligned data many ways while preserving metric definitions. pandas makes those aggregations explicit and repeatable, and Python can calculate per-series MASE scaling without proliferating helper columns. Excel remains the review surface for thresholds and published diagnostics.
Try it live
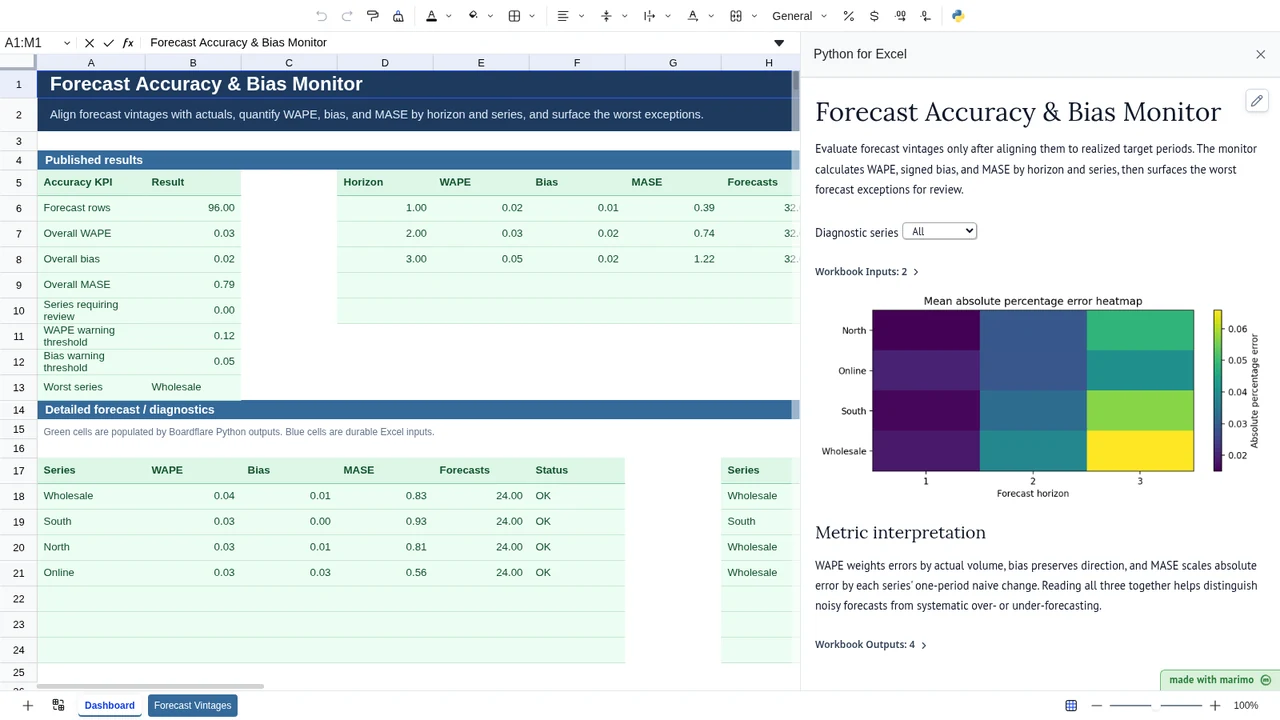
Change forecast values or warning thresholds and review which horizons and series move into exception status.
Operating workflow
Author: a forecasting or analytics owner maintains the vintage-alignment contract, metric definitions, exception logic, and published diagnostics.
Workbook user: a planning lead loads or refreshes aligned forecast/actual rows, adjusts review thresholds, and works the resulting series and horizon exceptions.
For a recurring forecast-review process, save the completed notebook to open in App mode so the operator can focus on warnings and diagnostics. The saved Python remains executable workbook content and should still be reviewed and trusted.
Download the Excel template
Inputs and assumptions
Forecast Vintages!A5:F101 contains 96 aligned forecast rows across four series, eight target periods, and three horizons. Dashboard!J5:K8 contains a 12% WAPE threshold, 5% bias threshold, and four top exceptions to publish. Target periods must be sortable within each series for MASE scaling.
Notebook implementation
The notebook uses bf.inputs(...) for the vintage table and durable review thresholds, calculates grouped performance in pandas/NumPy, and publishes summary, horizon, series, and exceptions tables. A notebook dropdown filters the diagnostic heatmap without changing worksheet outputs.
How the calculation/model works
Error is forecast − actual. WAPE is total absolute error divided by total absolute actual volume. Bias keeps the sign by dividing total error by the same denominator. MASE divides each absolute forecast error by the series’ mean one-period absolute actual change, then averages the scaled errors. The monitor groups these metrics by horizon and series, applies worksheet warning thresholds, and ranks row-level exceptions by absolute percentage error and absolute error.
Validation / expected results
The baseline checks 96 forecast rows, 3.28% overall WAPE, 1.55% bias, 0.785 MASE, Wholesale as the worst series, and 4.98% WAPE at horizon 3. A scenario changes one Online forecast to 190 and verifies 3.66% overall WAPE, 1.97% bias, 0.834 MASE, 6.12% horizon-3 WAPE, and a 45-unit top exception.
Limitations
The sample assumes actuals are final and each row is already aligned to the correct target period. WAPE can hide small-series problems, percentage errors are unstable around zero actuals, and one-period MASE scaling may not suit strongly seasonal series. Production monitoring should define data-finalization rules, hierarchy aggregation, exclusions, and metric governance explicitly.
When to use this approach
Use it when planners need a repeatable forecast-performance scorecard across horizons or business series. It is especially useful for separating systematic bias from general inaccuracy and for identifying where forecast quality degrades with lead time.