Cash Flow Forecast & Liquidity Outlook
Turn recent weekly receipts and payments into a forward cash outlook, then test how durable worksheet assumptions change liquidity headroom. The model separates historical trend estimation from scenario adjustments so users can see both the forecast mechanics and the planning overlay.
Result preview
With $275,000 starting cash, the baseline forecast ends at $485,793.25. Minimum base cash is $299,502.43 and the downside-band minimum is $288,556.39, both above the supplied $200,000 liquidity threshold. Over the final eight historical weeks, the trend model also beats a last-value baseline on inflow WAPE, outflow WAPE, and net-flow MAE.
What this template does
- Fits separate linear trends to weekly inflows and outflows.
- Evaluates the model with an eight-week expanding-origin backtest against a last-value baseline.
- Applies worksheet-controlled inflow and outflow scenario adjustments.
- Builds the cash balance from starting cash plus cumulative net cash flow.
- Widens an uncertainty band with forecast horizon using historical residual variability.
- Reports ending cash, minimum cash, downside minimum, and threshold-breach timing.
Why Python
A cash model quickly becomes harder to audit when trend fitting, scenario logic, cumulative balances, and uncertainty propagation are spread across many worksheet formulas. NumPy keeps the statistical mechanics compact while Excel remains the system of record for history, starting cash, planning adjustments, and the liquidity threshold.
Try it live
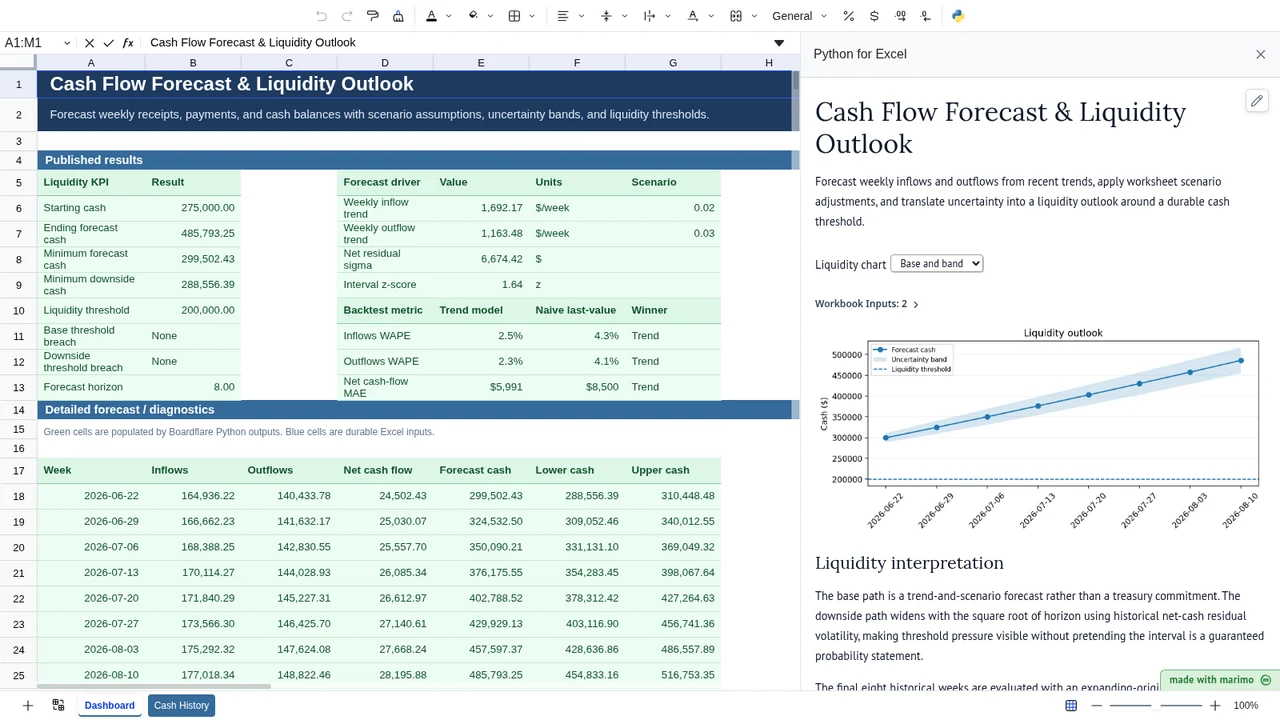
Edit the starting cash balance, scenario growth assumptions, horizon, or liquidity threshold to explore the resulting headroom.
Operating workflow
Author: an FP&A or treasury analyst maintains the cash-history inputs, trend/scenario logic, validation rules, and published liquidity diagnostics.
Workbook user: a finance manager updates starting cash, scenario adjustments, horizon, or the liquidity threshold and reviews the resulting cash headroom and breach warnings.
For a recurring handoff, the author can save the finished notebook to open in App mode so the workbook user sees the operating controls and results without the normal authoring surface. App mode changes presentation, not permissions or source access.
Download the Excel template
Inputs and assumptions
Cash History!A5:C29 contains 24 weekly observations for inflows and outflows. Dashboard!J5:K11 contains starting cash, an 8-week horizon, 2% inflow and 3% outflow scenario adjustments, a $200,000 liquidity threshold, and a 1.64 interval z-score. Historical amounts and cash controls must be non-negative; scenario adjustments must remain above -100%.
Notebook implementation
The notebook reads cash history and worksheet controls with bf.inputs(...) and publishes summary, drivers, backtest, and forecast tables. The notebook chart can hide or show the uncertainty band without changing worksheet outputs.
How the calculation/model works
Ordinary least squares estimates a weekly level and slope for inflows and outflows. Before fitting the final model, the last eight historical weeks are evaluated one at a time with expanding training windows; a last-value forecast from the preceding week provides the naive benchmark. The workbook publishes inflow/outflow WAPE and net-cash-flow MAE for both approaches. Scenario growth cells then act as multiplicative level adjustments to the full-history trend forecasts. Forecast cash is starting cash plus cumulative forecast net cash flow. Historical net cash flow minus fitted net cash flow provides a residual standard deviation; the displayed band expands by z × residual sigma × √horizon.
Validation / expected results
The baseline checks ending cash of $485,793.25, minimum cash of $299,502.43, downside minimum of $288,556.39, and no base threshold breach. It also verifies the time-aware backtest: inflow WAPE is 2.46% for the trend model versus 4.28% for the naive baseline, outflow WAPE is 2.30% versus 4.07%, and net-flow MAE is $5,991 versus $8,500. A scenario lowers starting cash to $150,000 and verifies ending cash $360,793.25, minimum cash $174,502.43, downside cash $163,556.39, and a first breach on 2026-06-22.
Limitations
This is a short-horizon planning model. It does not model invoice-level payment timing, known one-off transactions, revolving credit, restricted cash, bank-account structure, calendar effects, correlated inflow/outflow shocks, or tax/financing events. The uncertainty band is a planning diagnostic, not a formal confidence guarantee.
When to use this approach
Use it for weekly liquidity outlooks where recent cash behavior is informative and management wants transparent scenario controls. For treasury execution, replace or augment the trend model with known transaction schedules and account-specific constraints.