Time-to-event data, experimental designs, group comparisons, time series forecasting, and process monitoring need statistical methods that standard Excel functions do not provide: censored-data survival estimates, fractional factorial screening with aliasing, Welch ANOVA with post-hoc tests, holdout backtesting of ARIMA and ETS models, control charts with run rules, and capability indices.
Boardflare brings Python’s statistical toolchain (numpy, scipy, statsmodels) into desktop Excel and Excel for the web. Each statistics template is a bounded studio: you paste data and choose a few settings, and the workbook computes the results, native Excel charts, and a Validation sheet that checks the engine against published reference output.
Common Applications
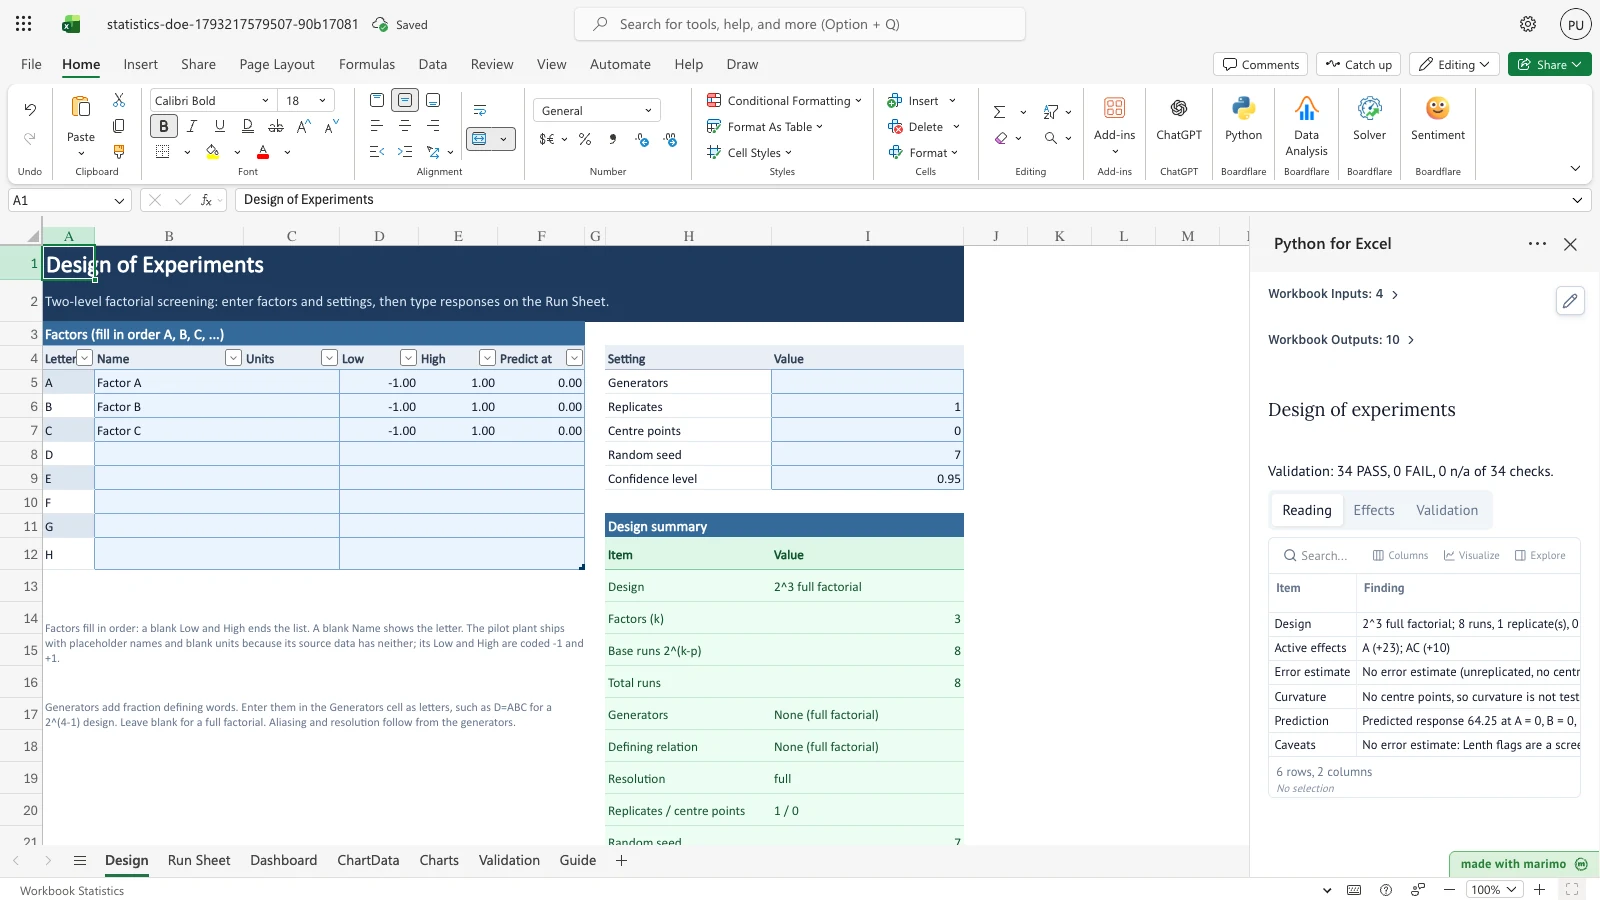
- Design of Experiments (DOE): Two-level full and fractional factorial screening designs (\(2^k\) and \(2^{k-p}\)), randomized run sheets, alias and confounding structure, Pareto and half-normal probability plots, Lenth PSE screening for unreplicated runs, and ANOVA curvature tests.
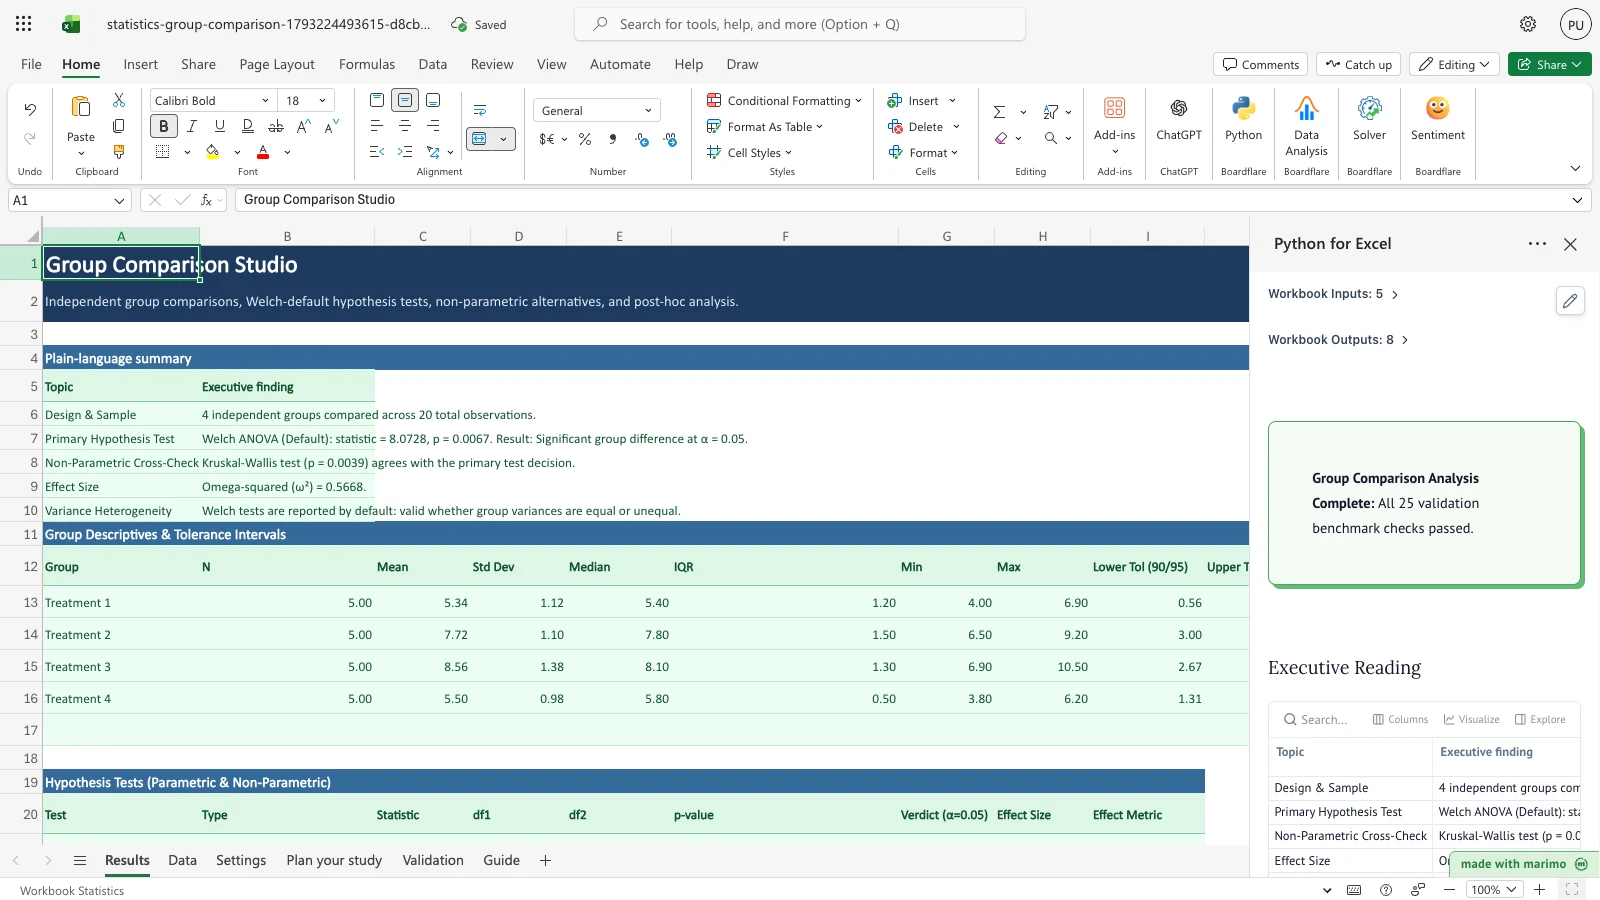
- Group Comparison: Independent group comparisons with Welch’s \(t\) and Welch ANOVA by default, Mann-Whitney \(U\) and Kruskal-Wallis non-parametric alternatives, Games-Howell and Tukey HSD post-hoc tests, tolerance intervals, and sample size power planning.
- Time Series Forecasting: Out-of-sample holdout backtesting comparing ARIMA/SARIMA and exponential smoothing (ETS) candidate models, point forecasts with 95% prediction intervals, and automated residual diagnostics (Ljung-Box, ACF/PACF, ADF).
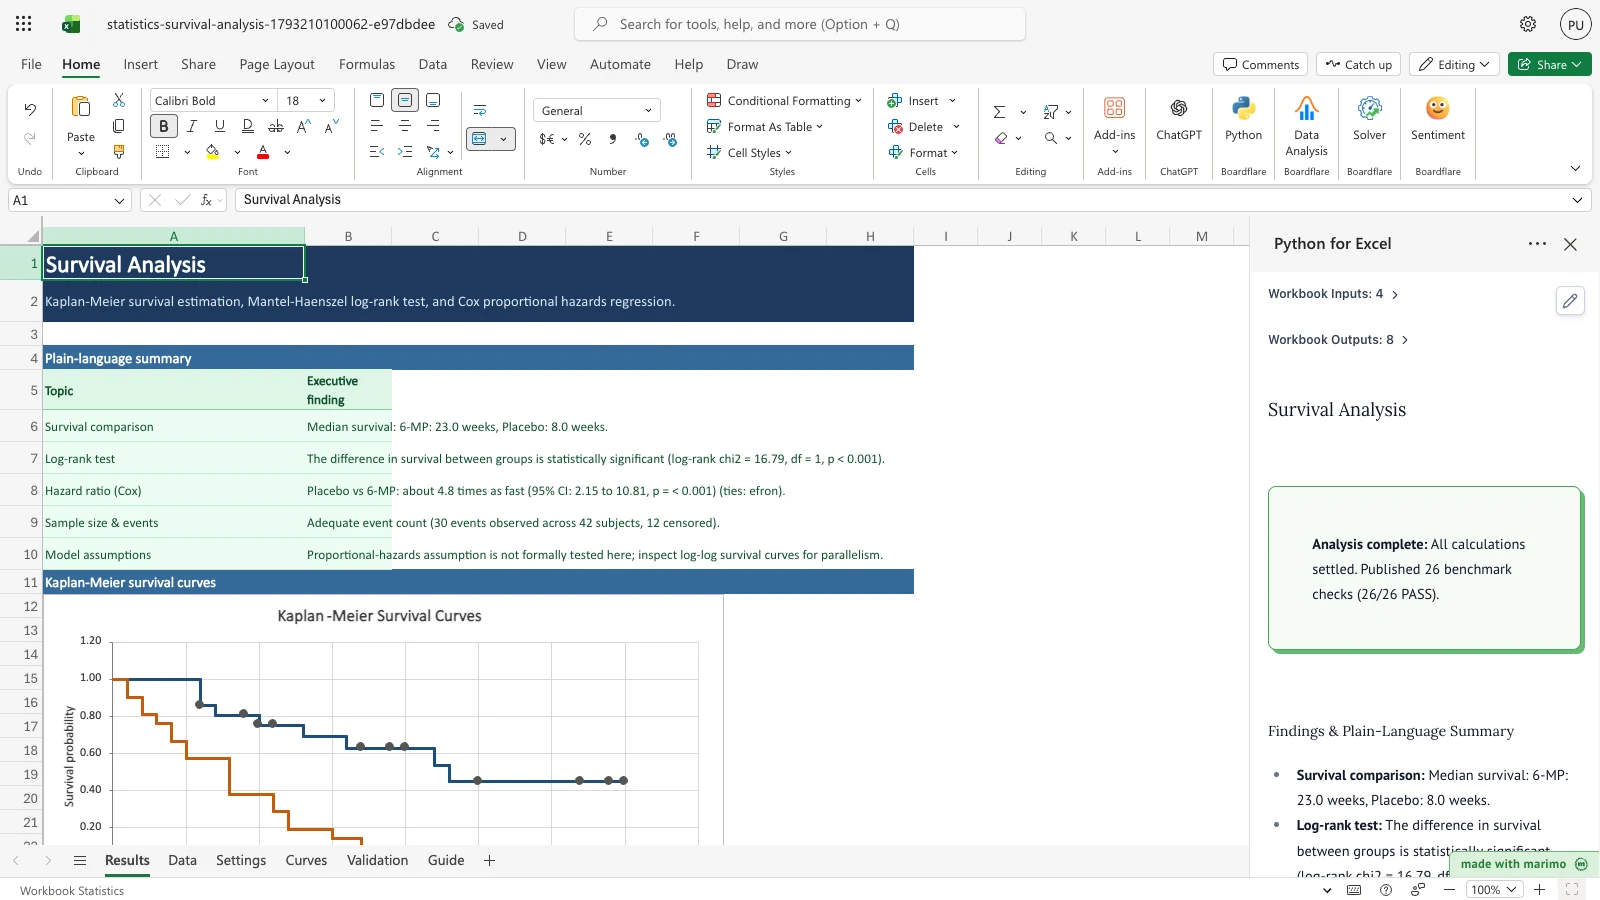
- Survival Analysis: Kaplan-Meier curves with Greenwood confidence intervals, Mantel-Haenszel log-rank tests across groups, and Cox proportional-hazards regression with hazard ratios and concordance.
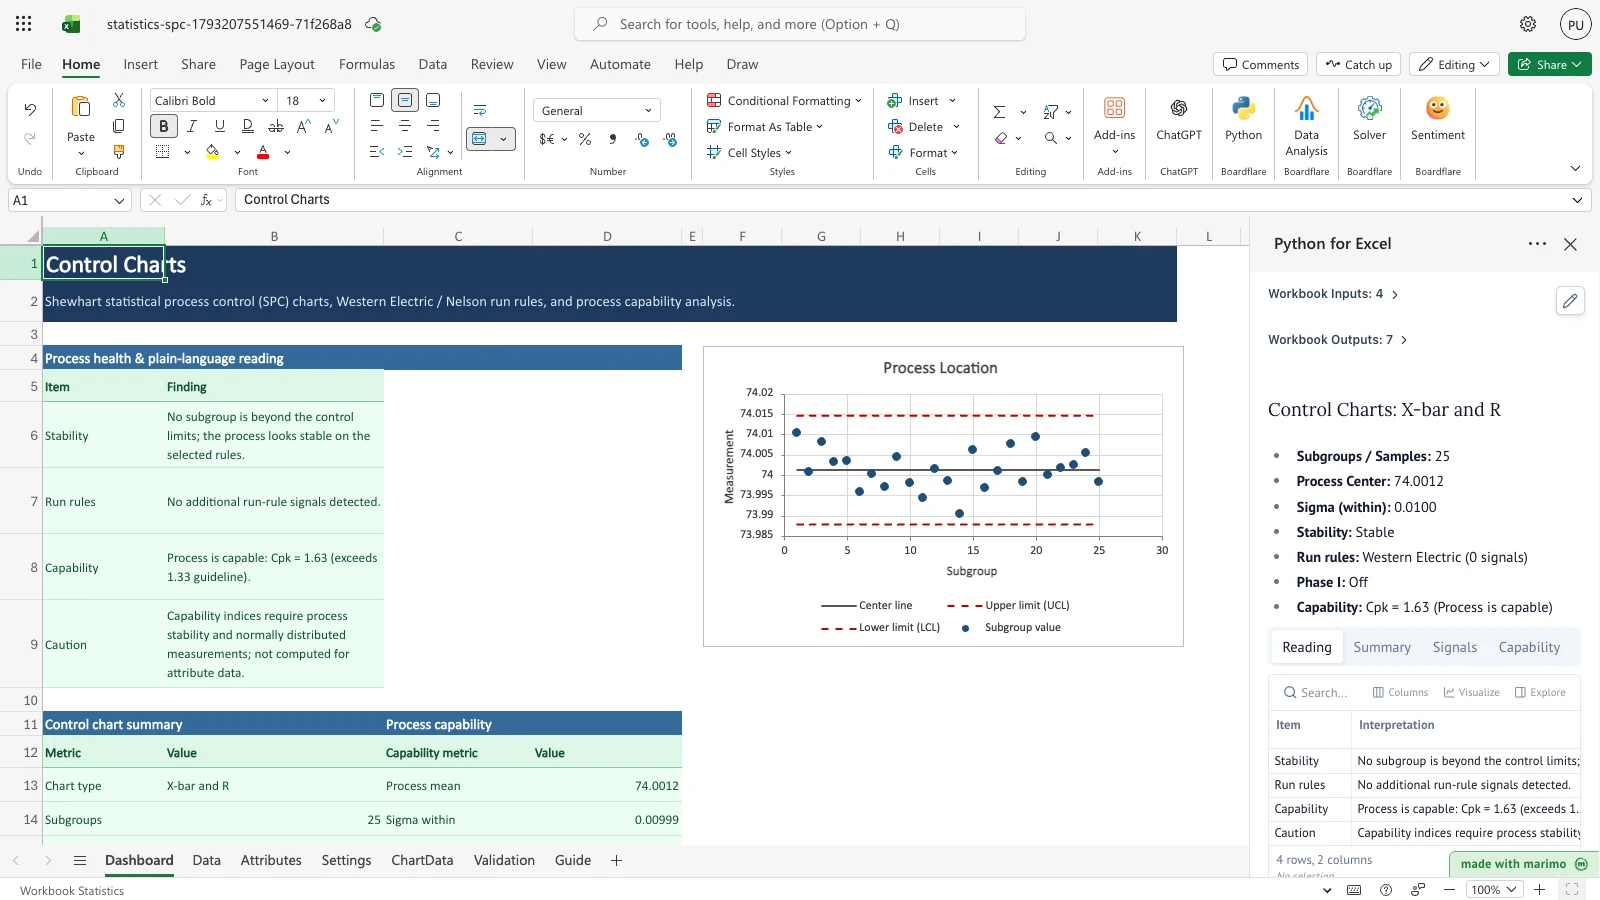
- Statistical Process Control (SPC): X-bar/R, X-bar/S, I-MR, p, np, c, and u charts with Western Electric and Nelson run rules, and Phase I screening that removes out-of-control subgroups.
- Process Capability: \(C_p\), \(C_{pk}\), \(P_p\), and \(P_{pk}\) for normally distributed processes.